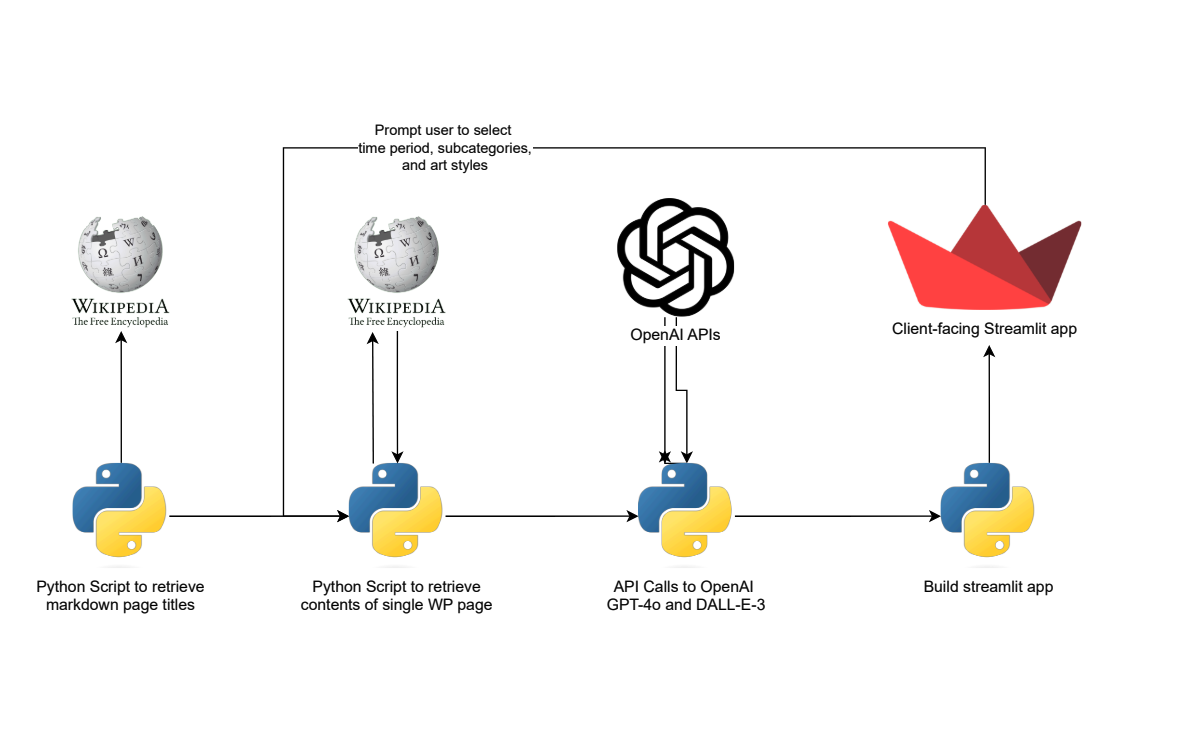
Wikipedia2Story

DALL-E image gen of user-selected Wikipedia history pages
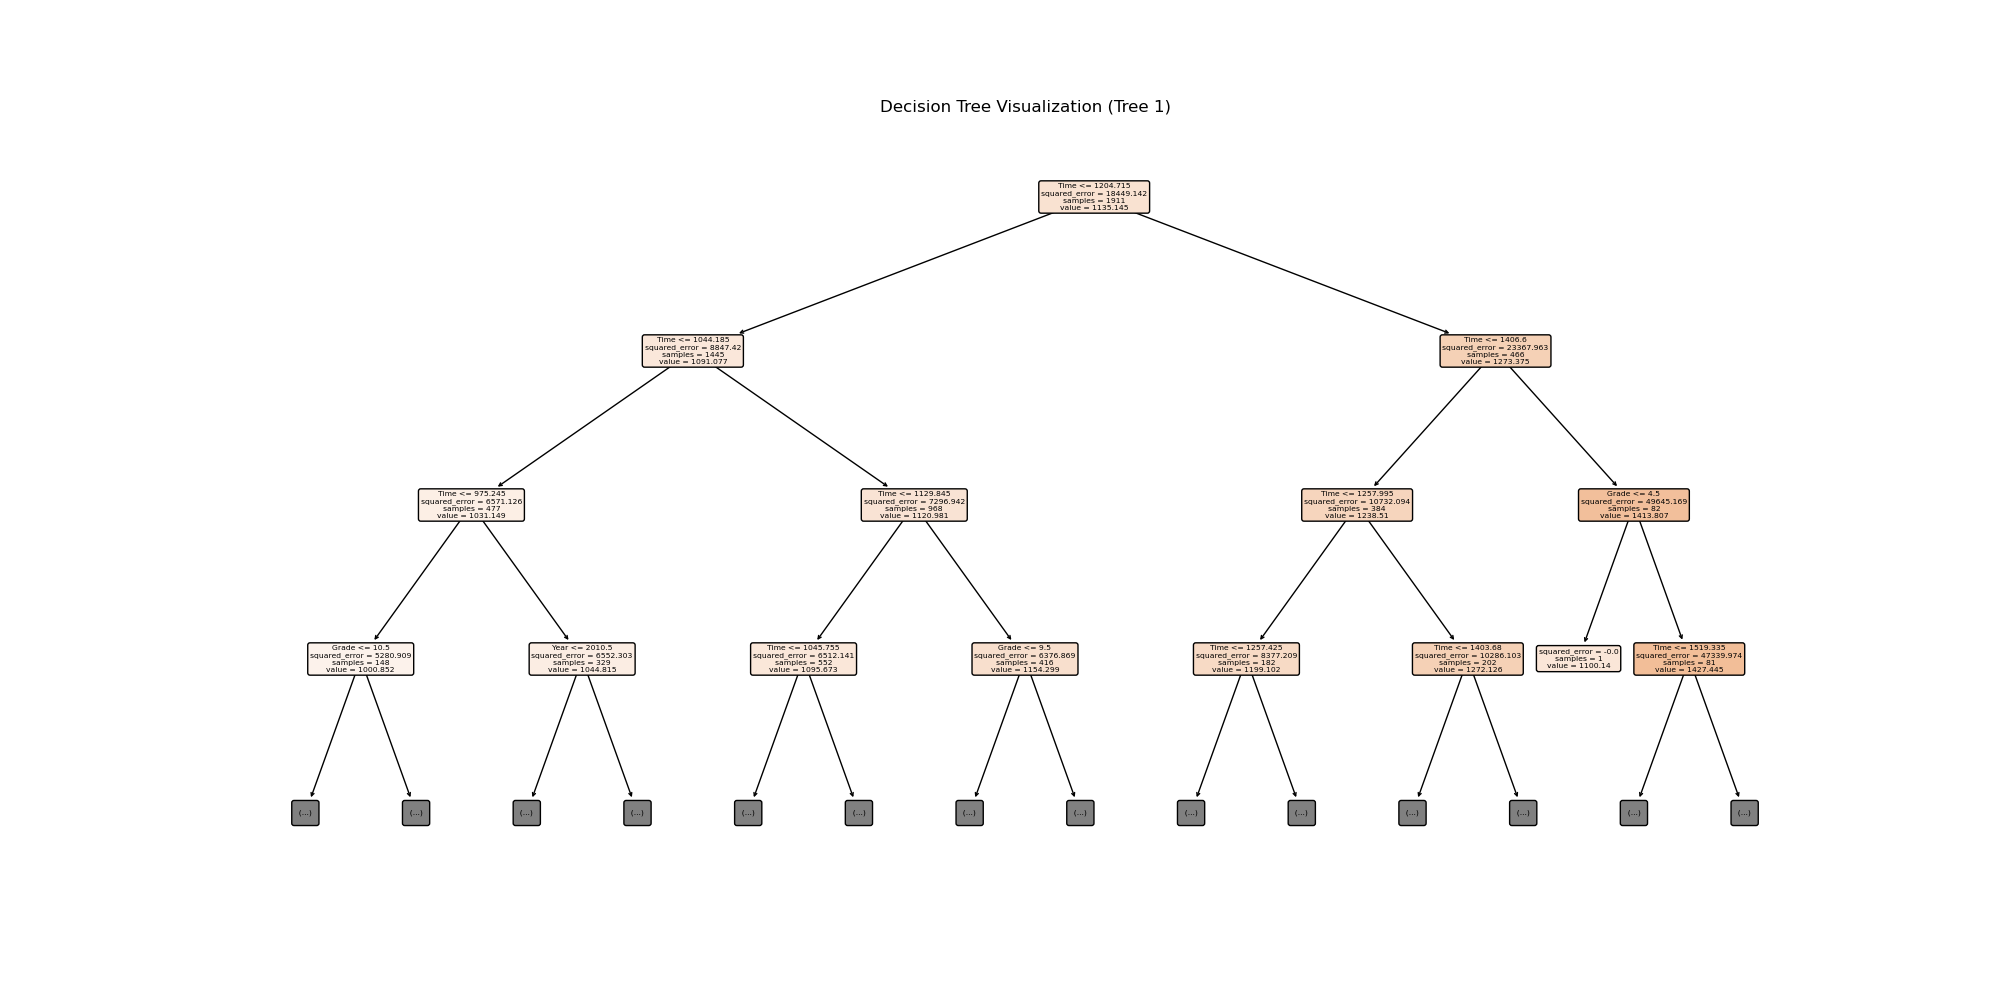
XC Random Forest
XC team rankings predictions using random forest
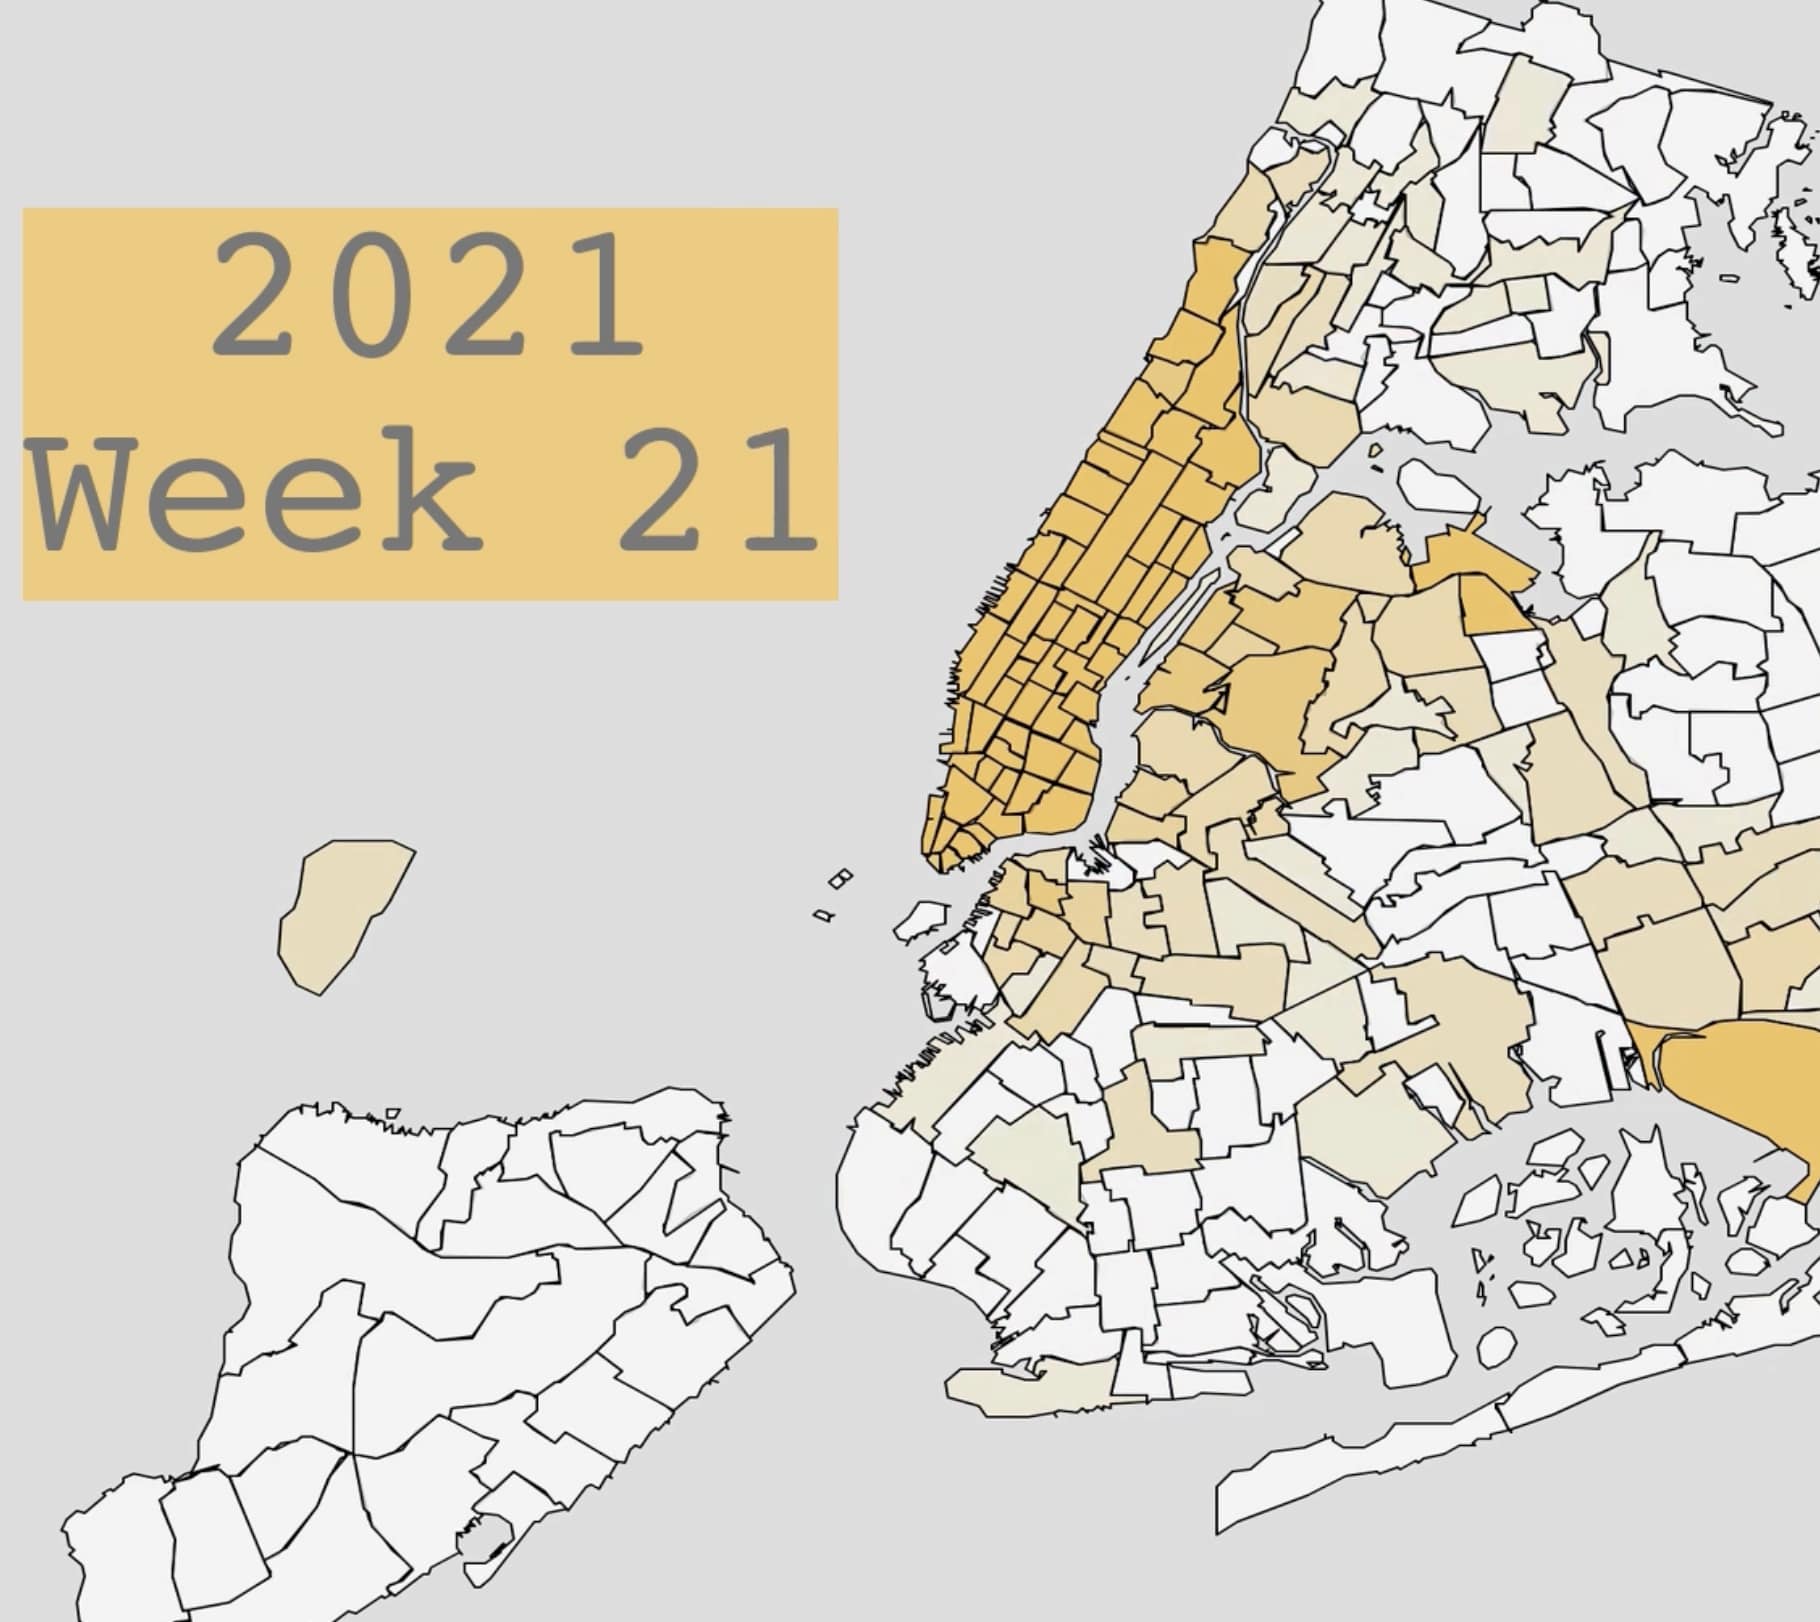
NYC Taxi Demand
Time-lapse of NYC Taxi Zones from 2018-2022
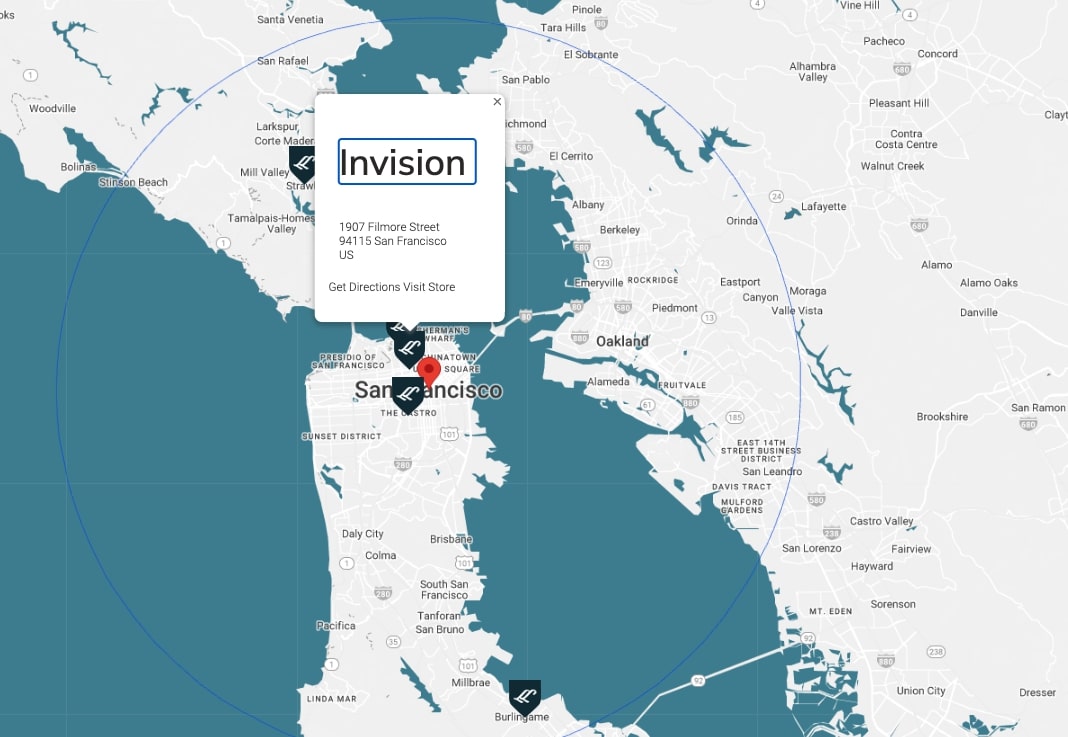
Location Scraper
Scraper to standardize location data using string matching techniques
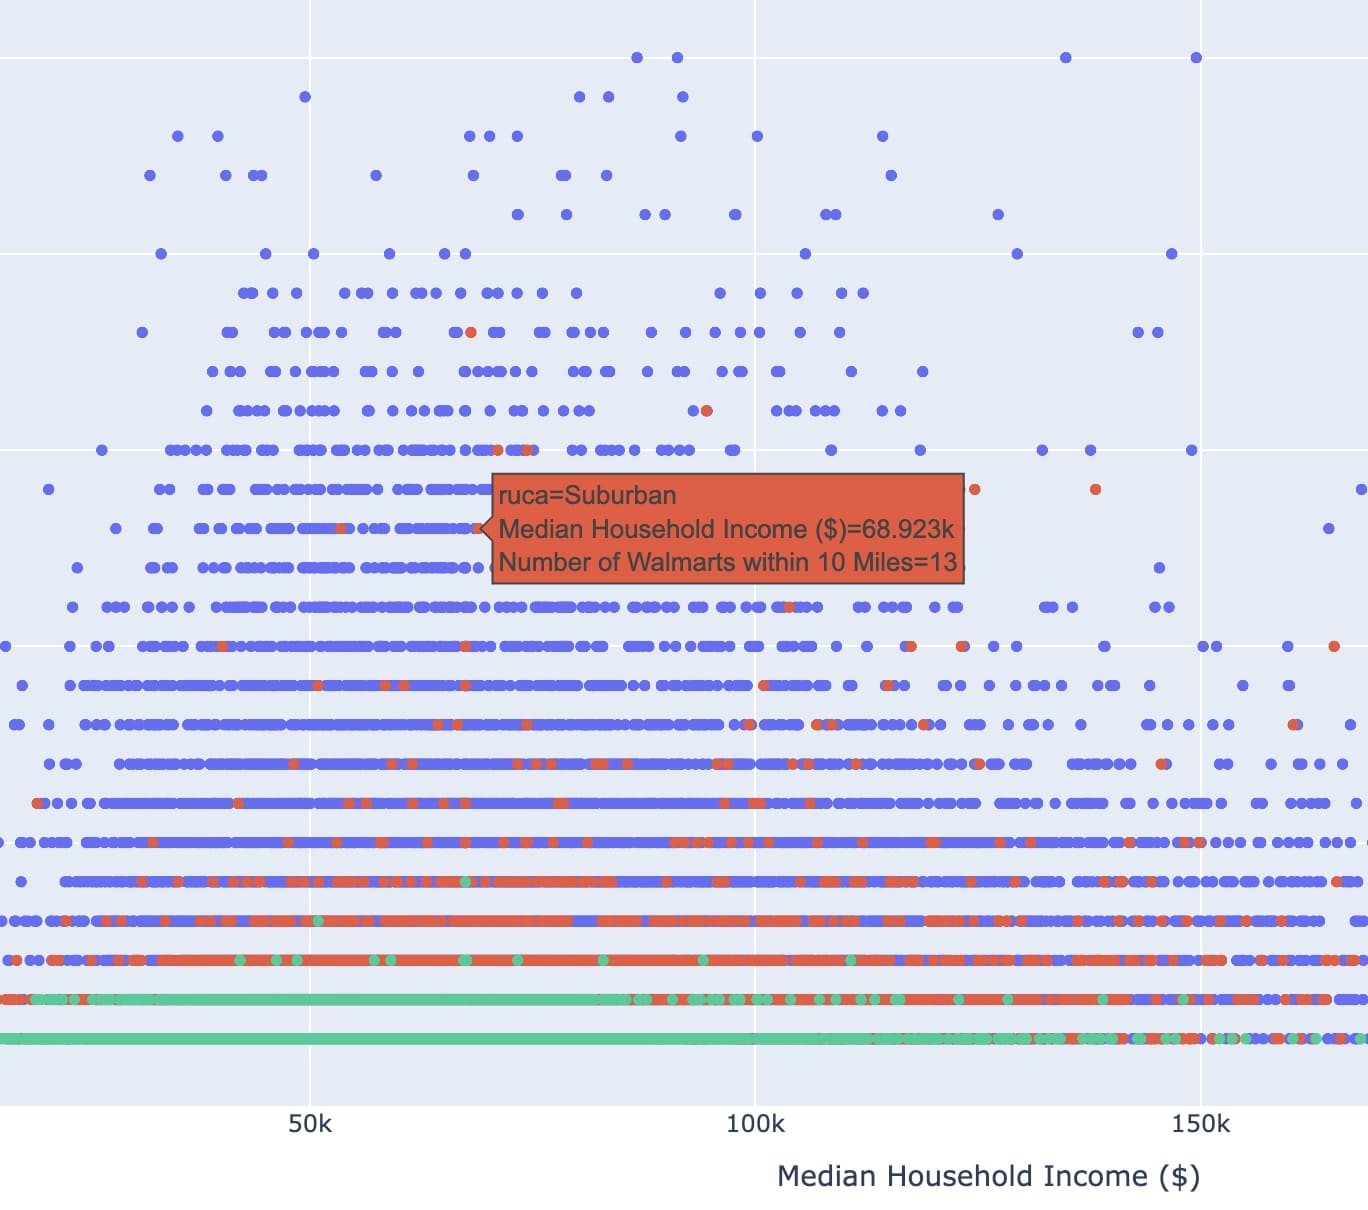
Walmart Proximity
Examining the claim that "Walmart is within 10 miles of 90% of Americans"
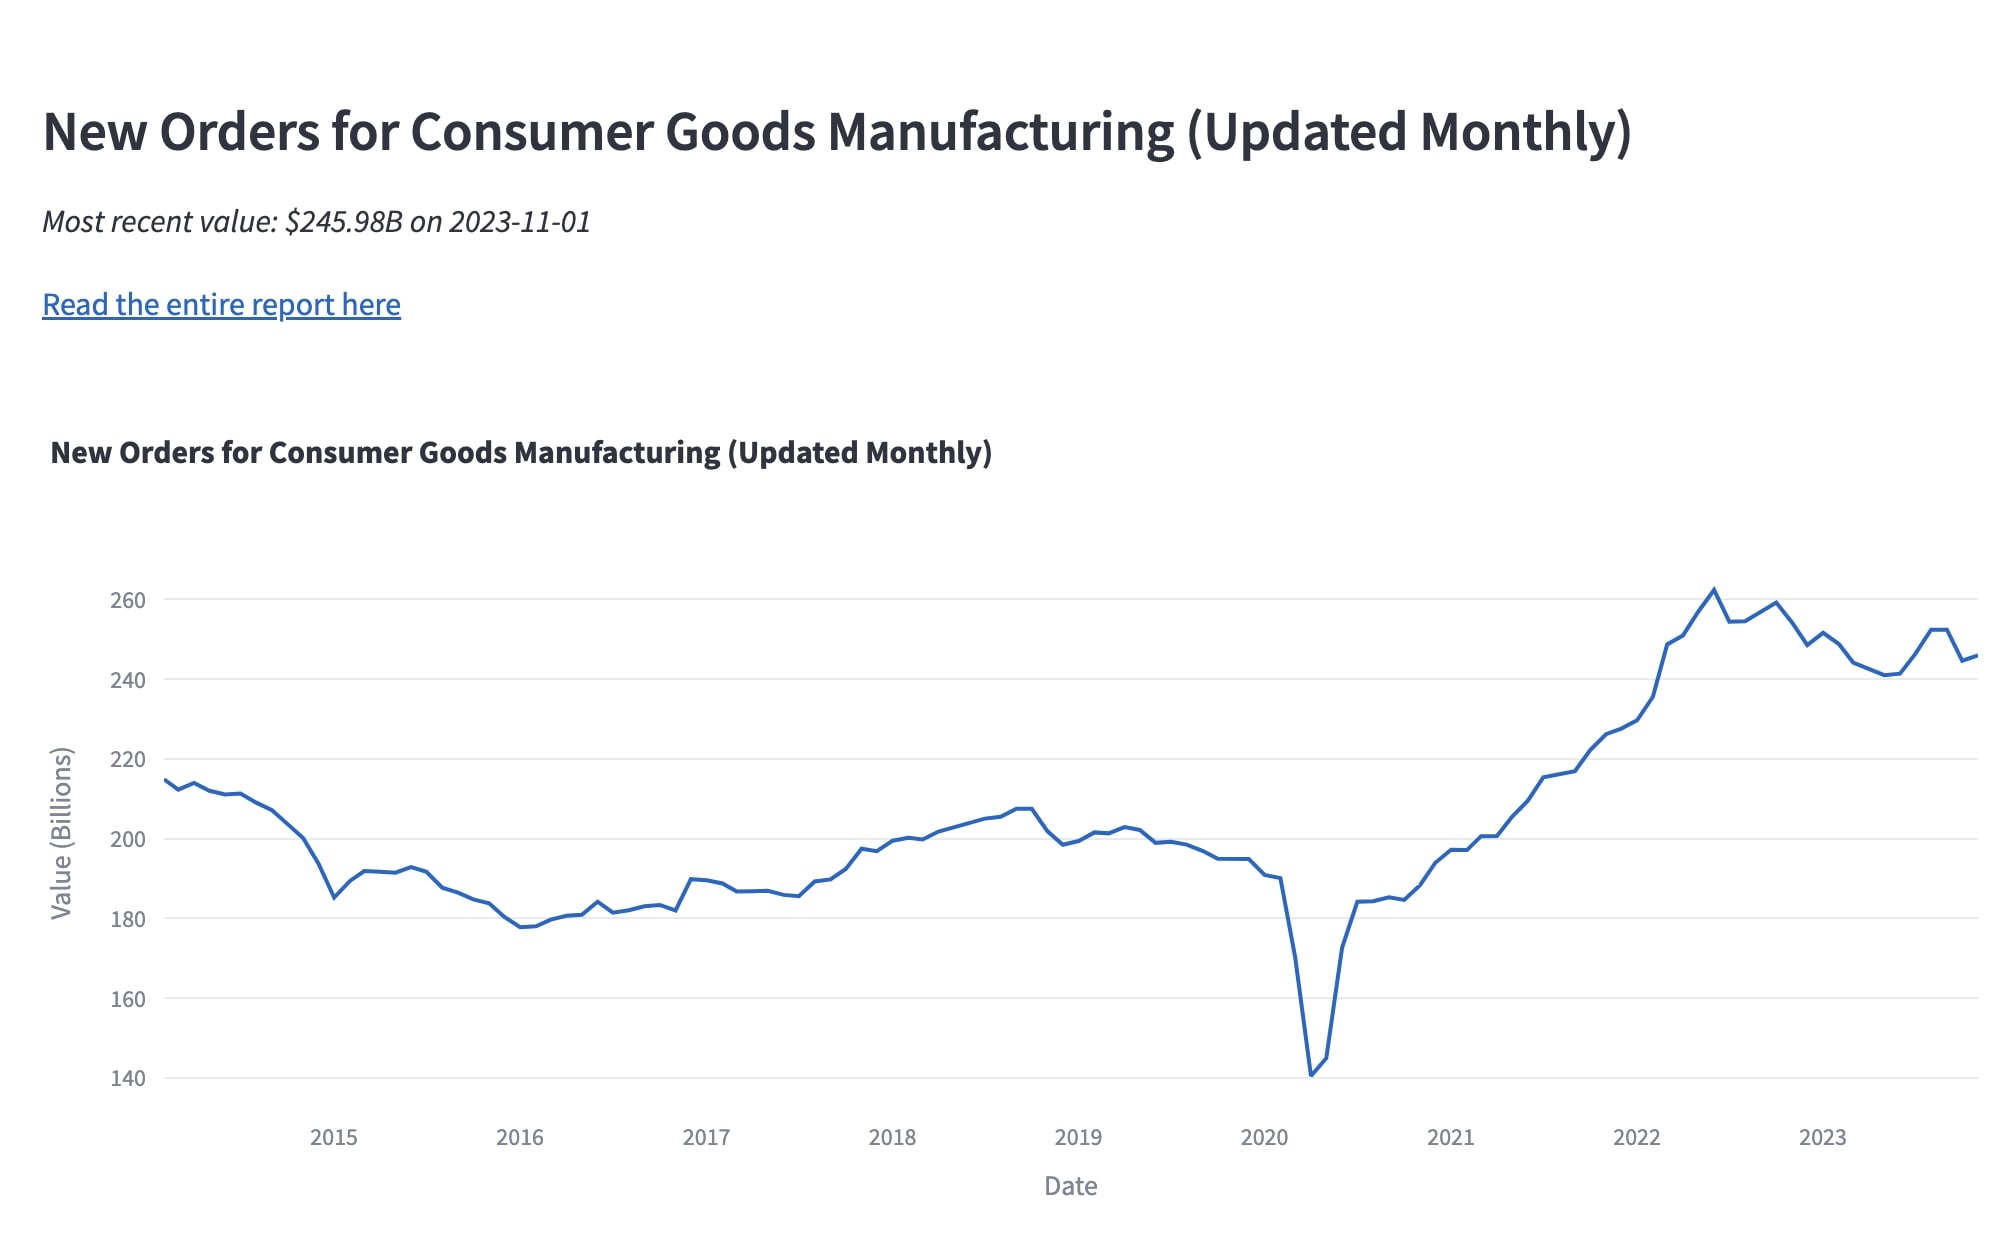
Economic Indicators
Real-time economic indicators dashboard. Updated daily.